Features
Here are some of GoAccess' features and the stuff it can do for you…
Here are some of GoAccess' features and the stuff it can do for you…
Enhanced WebSocket authentication supporting local and external JWT verification, with secure token refresh and seamless integration with your existing authentication systems.
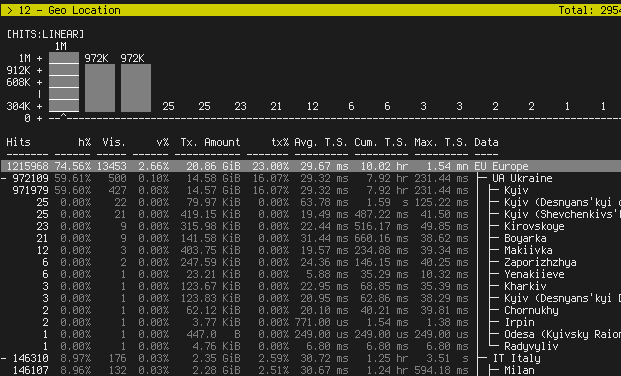
Autonomous System Number mapping lets you detect malicious traffic patterns at a glance and block offending networks accordingly.
All panels and metrics update every 200 ms on the terminal output and every second on the HTML output — no lag when incidents happen.
Track the time taken to serve each request. Extremely useful for spotting slow endpoints and diagnosing performance bottlenecks before they become outages.
You can just run GoAccess against your access log file, pick the log format, and let it parse the log to show real-time stats. Perfect for DevOps or sysadmins who want quick insights with no fuss.
Process logs incrementally with on-disk persistence — append new data to existing datasets without re-parsing from scratch.
Any custom log format string is supported. Predefined options include Apache, Nginx, Amazon S3, Elastic Load Balancing, CloudFront, and more.
Build GoAccess from upstream Docker images, fully configurable via volume mapping and goaccess.conf. docker-compose documentation included.
Running multiple Virtual Hosts or Server Blocks? A dedicated panel shows which host is consuming the most web server resources.
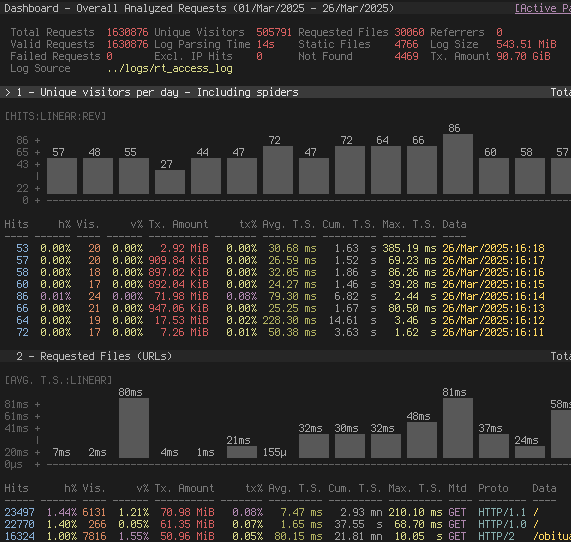
Real-time log analysis through a dashboard in multiple output formats.
By default, GoAccess outputs to a terminal in real time. GoAccess' dashboard gives you an overview of server metrics by displaying summaries of different reports as panels on a single scrollable view.
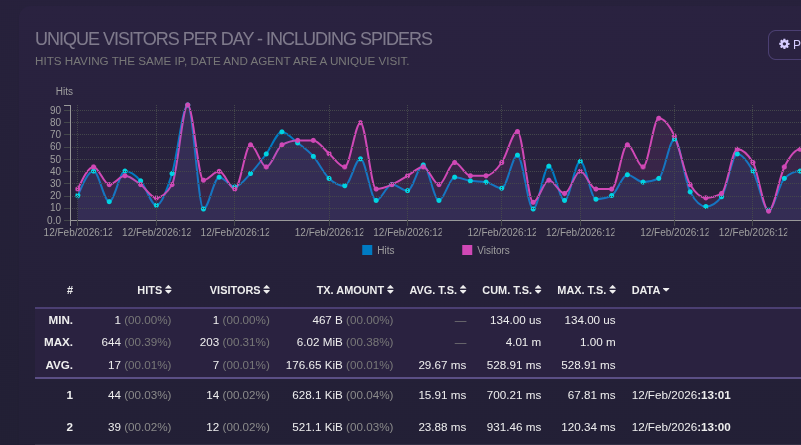
Apart from the terminal output, GoAccess allows you to generate HTML, JSON, or CSV reports. You can even email the HTML file since it is composed of a single file with no external dependencies. Check out the Live Demo.
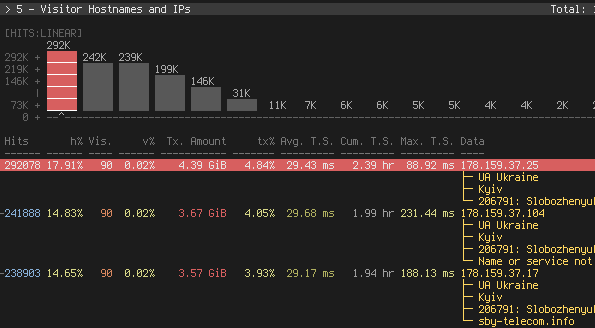
Spotting aggressive crawlers/bots and identifying who's eating your bandwidth is easy with the host panel. It also features the ability to display a list of user agents per each host.
The dashboard is composed of multiple report panels, which can be expanded to reveal subitems recursively for deeper insights. You can reorder panels to customize your view, and visualize different metrics using linear or logarithmic scales. This allows you to quickly spot correlations, trends, and anomalies across your server reports.